
By default, Nmap scans the most common 1,000 TCP ports. How does it decide which ones, what coverage does that result in, and what are the ramifications for real world port scanning? Let’s look at the actual numbers behind Nmap’s top ports.

Nmap packages a flat file named nmap-services containing prevalence data on open ports gathered from survey scans of servers. The current version of the file I have here in /usr/share/nmap/ is the one packaged with Nmap 7.60, tagged with a date of 7/31/2017. It identifies 8,299 ports using the TCP protocol, 19,022 ports using the UDP protocol, and 52 ports using the virtually unknown SCTP protocol.
This hand curated list is termed the Well Known Port List. Alongside the protocol and port number, each entry includes a short service identifier and a field quantifying the ratio of servers observed to have the given port open – in other words, the expected likelihood of finding the port open in the field – on a probability scale from zero to one. This Port Frequency data underlies Nmap’s top ports scan modes.
There are, nominally speaking, 65,535 ports available in each of these network protocols. But scanning all 64k ports from outside a firewall takes a long time. (Trust me, I do it all the time during vulnerability assessment scanning.) Unless you’re specifically interested in an exhaustive scan, it’s a waste of effort. Most of the time, you’re interested in Well Known services, and, as shown, there are far fewer than 64k of them known, at any prevalence.
So, when you scan a target with Nmap and pass no particular arguments, you’re getting a top 1,000 TCP ports scan, defined as the 1,000 ports in nmap-services with the highest prevalence values. If you request a UDP scan with the -sU argument and specify nothing else, you’re getting the top 1,000 UDP ports in the file. You may also explicitly request the top n ports using the –top-ports n argument of your choice, or go down to a specific prevalence value with the –port-ratio r argument.
If 1,000 seems like a completely arbitrarily chosen number, it is. What’s really going on in the data? Let’s look under the hood and see if it has anything interesting to tell us.
Well Known TCP Ports
Of the 8,299 TCP ports named in nmap-services, only 4,260 have corresponding prevalence values greater than zero. The most common service is HTTP port 80, with a prevalence value of 0.484143. Accordingly, you’d expect about half of servers to have HTTP open. Sounds right for an organization’s internal network, probably too low an estimate for the WAN, where nearly everything you see is a web server.
Just to the second entry, Telnet port 23, prevalence falls to 0.221265, so a bit more than one in every five servers. By the 10th entry, prevalence is down to about one in every 20 servers. By the 100th, one in more than every 300.
The top 1,000 default TCP port scan will scan down to a prevalence of 0.000152, about one in almost 6,600 servers. The last entries before the prevalence values zero out, at sort position 4,260 in the list, would only be expected to be open on one in about 77,000 servers. Going out to top 5,000 would get you no (or indeterminable) further gain beyond the end of the known prevalence measurements.
What we have here is a power law, which is typical of complex engineering phenomena. And here is the log-log chart to prove it, along with a box of the top 15 TCP services:
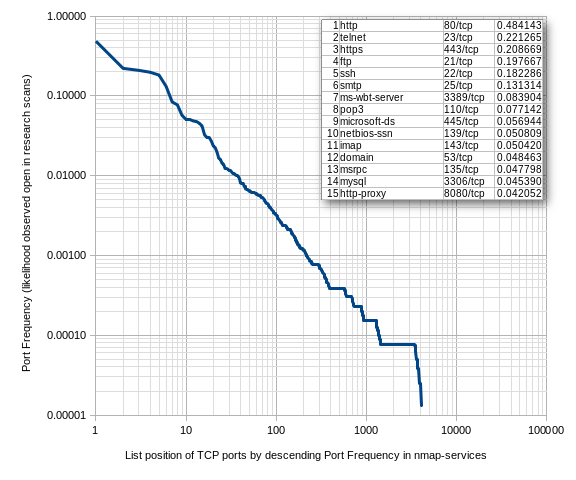
See the nice straight line on the log-log chart? Prevalence varies like list position to the power -k. Not shown here, but fit k = 1.166.
Well Known UDP Ports
Let’s do UDP. (Poor UDP, so oft neglected.) Of the 19,022 UDP ports named in nmap-services, some 15,617 have corresponding prevalence values greater than zero. The most common service is IPP port 631, a printing service which might ring a bell if you run CUPS, with a prevalence value of 0.450281. This is again around half of servers, which has got to be way too high for the internet at large, but that’s what the survey has, reinforcing the interpretation that it’s based on data from internal networks.
The falloff of prevalence in the UDP service data is much less pronounced than for TCP services. The 10th entry has prevalence of better than one in every five servers. The 100th, one in roughly every 140.
The top 1,000 default UDP port scan will scan down to a prevalence of 0.001307, about one in every 765 servers. (Compare these to the numbers for TCP above.) Going out to top 5,000 would get you services seen on about one in every 1,500 servers. The last entry before the prevalence values zero out, at sort position 15,617 in the list, would be expected to be open on one in about 5,500 servers.
Here is the chart for UDP, along with the top 15 UDP services (note that I rendered the TCP and UDP charts with the same axes so they’re directly comparable):
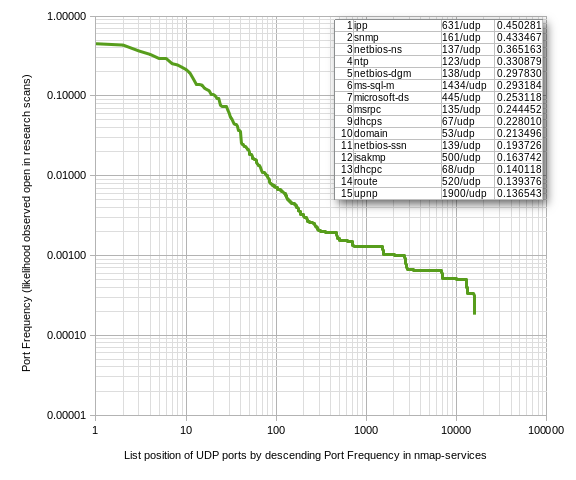
Not as straight a line! Still power law, but the log-log chart brings out irregular features. Unexpectedly prevalent UDP services presenting as a bulge near the top. The curve conforms best to a linear fit after about list position 100. Fit k = 0.520, much more slowly down sloped, with a longer tail.
So there are more Well Known UDP services in the data than TCP, and they’re more prevalent than TCP services. From my experience with internet servers I would never have expected UDP services to be so much greater in number and prevalence. I see a lot of DNS, NTP, and ISAKMP out there on UDP but that’s about it. But I suppose this result doesn’t come as a surprise to network administrators of internal corporate networks, where UDP services are not firewalled.
Ramifications
Alright, what can we get from this besides pretty graphs?
- Coverage in the top 1,000 default TCP port scan is 1.5% of the nominal port address space, 12% of 8,299 Well Known named ports, 23% of those 4,260 with nonzero known prevalence, and could miss services seen on less than one in about 6,600 servers. Going out to top 5,000 buys you 60% of Well Known named ports, 100% of those with nonzero known prevalence, and effectively the end of the known prevalence space.
- Because there are comparatively few Well Known TCP ports in play, there is no reason to scan all 65,535 TCP ports in general… unless you really, really require to run the whole exhaustive 64k for your application case. Just the top 1,000 gives you very good coverage. If you’re missing one you know is there (I have several customers with a Sonicwall service exposed on WAN TCP port 4433 for example, which is not in Nmap’s top 1,000), going out to top 5,000 will probably catch it.
- Coverage in the top 1,000 default UDP port scan is also 1.5% of the nominal port address space, but 5.3% of 19,022 Well Known named ports, 6.4% of those 15,617 with nonzero known prevalence, and could miss services seen on less than one in about 765 servers. Going out to top 5,000 buys you 26% of Well Known named ports, 32% of those with nonzero known prevalence, and could pick up services seen on as few as one in about 1,500 servers, so about twice as rare. But you can throw that all out the window for internet facing servers, cause there’s no way UDP is this exposed on the WAN.
- It’s a challenge to scan UDP on the WAN. The full 65,535 from an external test posture is so time consuming as to be impracticable. Malware authors take note, if you’re trying to hide a network listener where no one will look for it (and can forego guaranteed stream reconstruction), some random UDP port would be a good choice. In any case, Nmap’s UDP prevalence data overestimates UDP service exposure on the external network.